
Security Insights scans now run more often. Cloudflare scans Free accounts every 7 days, Pro and Business accounts every 3 days, and Enterprise accounts daily.
In addition, all accounts and zones now receive scans by default. You no longer need to enable scans before Cloudflare checks your account for misconfigurations, vulnerabilities, and other security risks.
Granular on-demand scans are now available on any plan. You can trigger an on-demand scan for any zone, insight, insight type from the Cloudflare dashboard in order to quickly re-check your security posture after remediating an issue.
To learn more, refer to the Security Insights documentation.
When you connect third-party MCP servers through MCP server portals, you have no control over how the server author named tools or wrote descriptions. Unclear names make it harder for AI agents to select the right tool and harder for users to understand what is available.
You can now rename tools and prompts and rewrite their descriptions directly on the portal, without modifying the upstream server. For example, a tool named
super_cool_toolcan becomesearch_customer_recordswith a description tailored to your organization.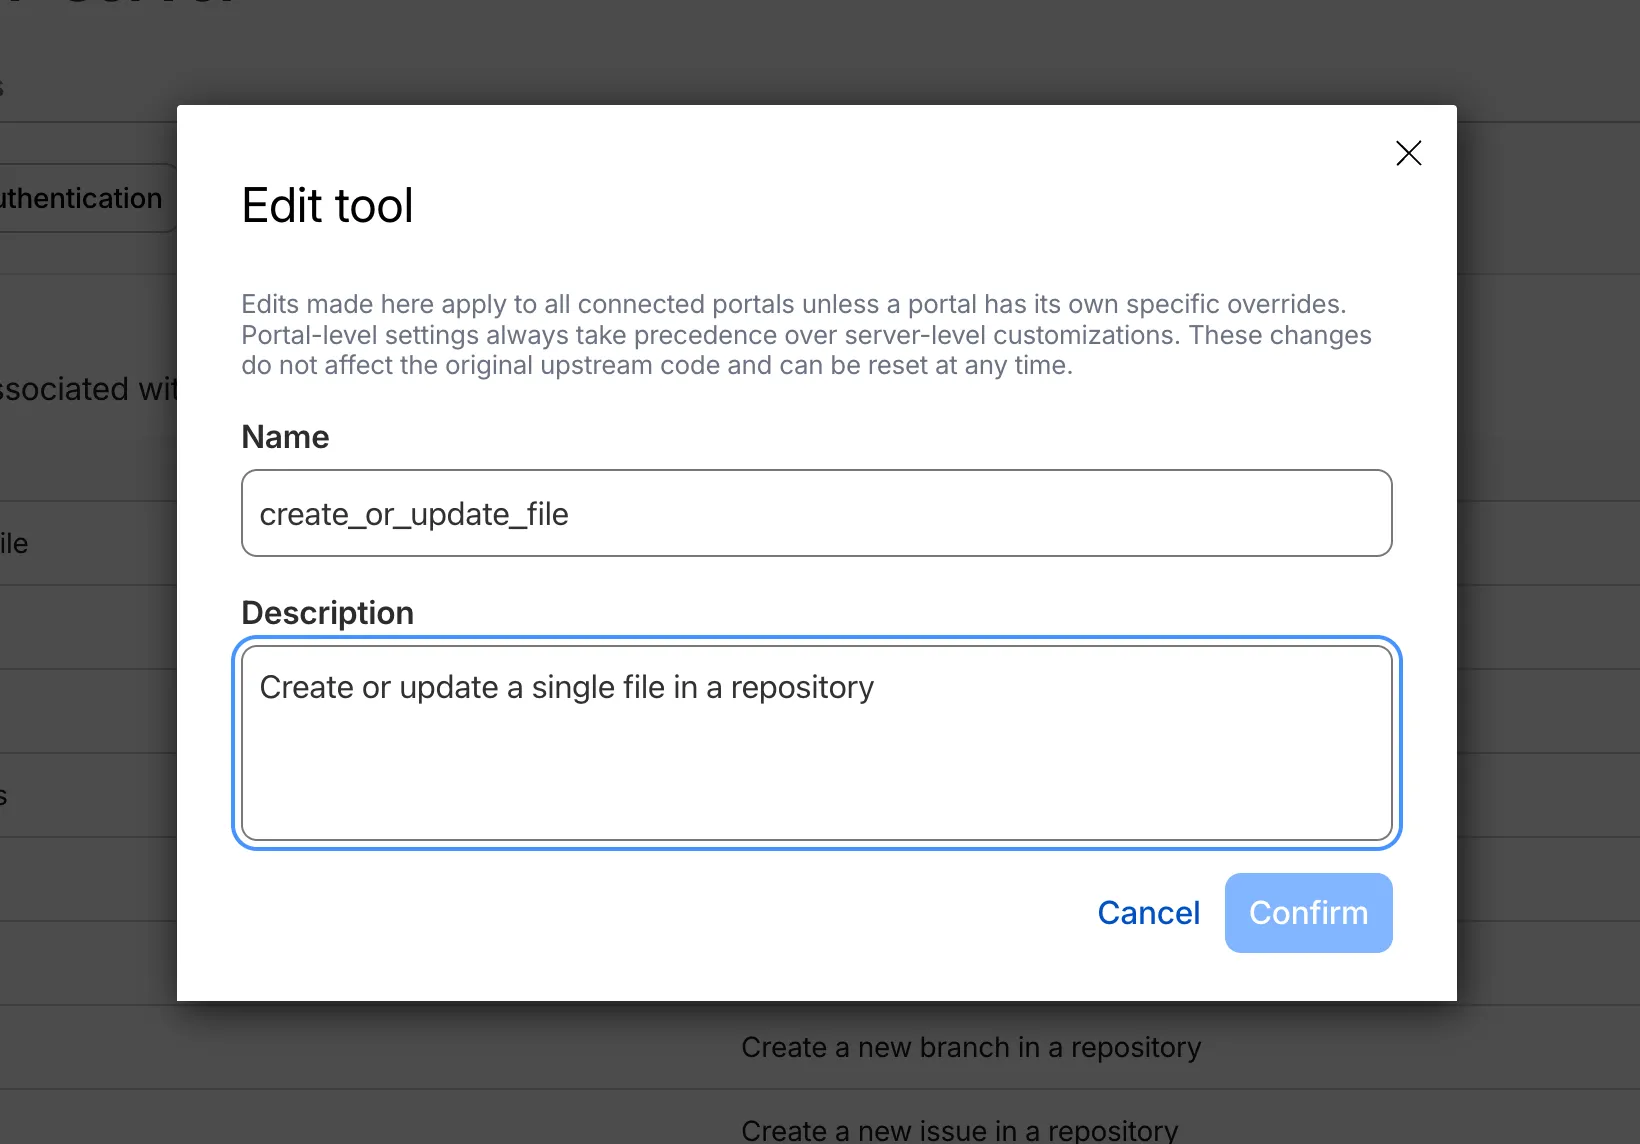
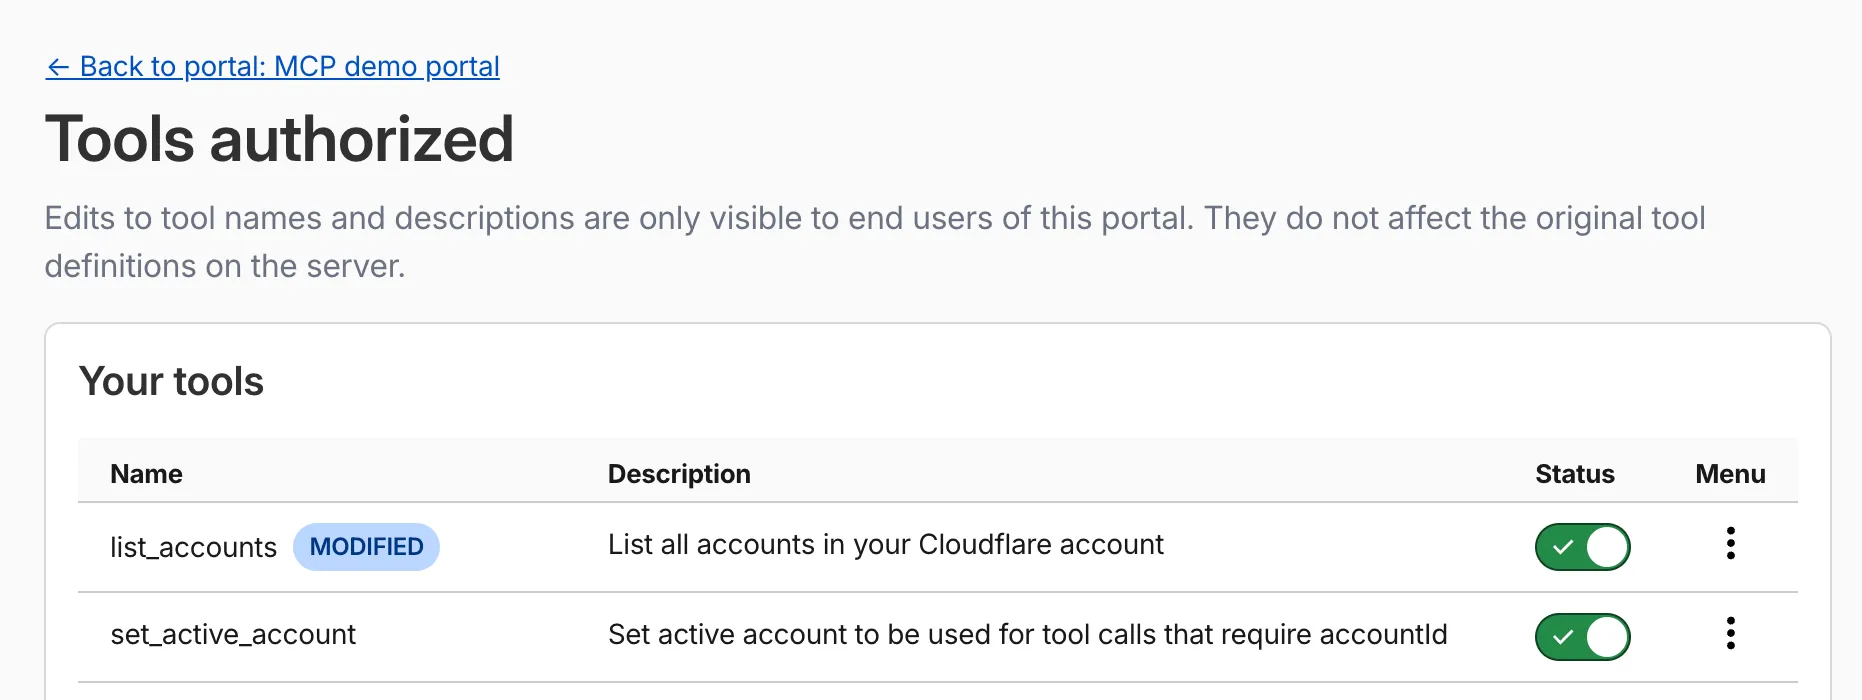
Modified tools display a Modified label in the tools list so administrators can see which tools have been customized at a glance.
Aliases override the metadata that MCP clients receive. You can set them at two levels:
- Per portal: Applies only within a specific portal. Takes precedence over server-level aliases.
- Per server: Applies across all portals that use the server.
You can reset an alias at any time to restore the original upstream name.
For more information, refer to Tool and prompt aliases.
You can now call Browser Run Quick Actions directly from a Cloudflare Worker using the
quickAction()method on the browser binding. This simplifies how Workers interact with Browser Run by removing the need for API tokens or external HTTP requests. Your Worker communicates with Browser Run directly over Cloudflare's network, resulting in simpler code and lower latency.With the
quickAction()method you can:- Capture screenshots from URLs or HTML
- Generate PDFs with custom styling, headers, and footers
- Extract HTML content from fully rendered pages
- Convert pages to Markdown
- Extract structured JSON using AI
- Scrape elements with CSS selectors
- Get all links from a page
- Capture snapshots (HTML + screenshot in one request)
To get started, add a browser binding to your Wrangler configuration:
JSONC {"compatibility_date": "2026-03-24","browser": {"binding": "BROWSER"}}TOML compatibility_date = "2026-03-24"[browser]binding = "BROWSER"Then call any Quick Action directly from your Worker. For example, to capture a screenshot:
JavaScript const screenshot = await env.BROWSER.quickAction("screenshot", {url: "https://www.cloudflare.com/",});TypeScript const screenshot = await env.BROWSER.quickAction("screenshot", {url: "https://www.cloudflare.com/",});The
quickAction()method requires a compatibility date of2026-03-24or later.For setup instructions and the full list of available actions, refer to Browser Run Quick Actions.
The Cloudflare Mesh dashboard now shows per-replica details for high availability nodes. You can see which replica is active, view each replica's Mesh IP and connection details, and manually trigger failover — all from the node detail page.
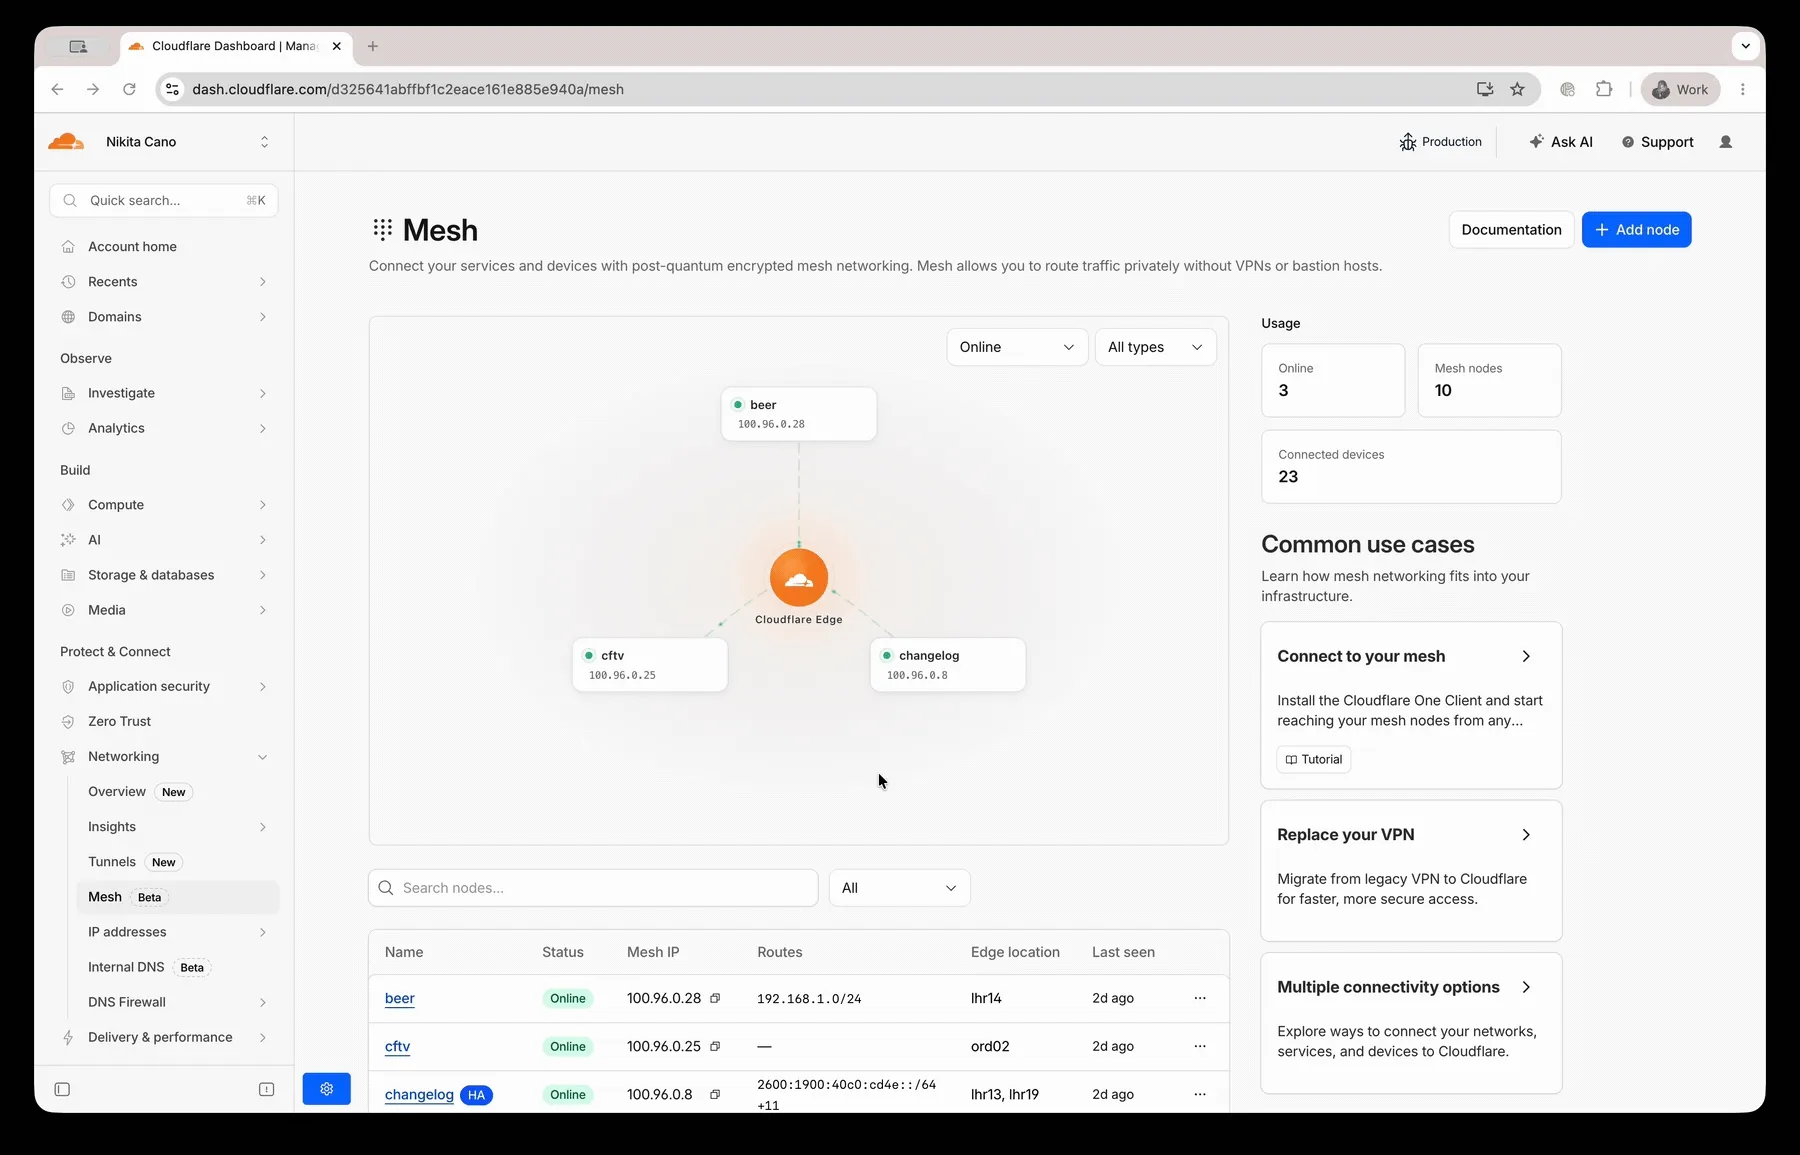
- Replica tabs on the node detail page — switch between replicas to see each one's Mesh IP, edge data center, origin IP, platform, version, and uptime.
- Active/passive badges identify which replica is currently routing traffic.
- Manual failover — promote a passive replica to active with a single click. The previous active replica switches to standby.
- HA badge in the overview table identifies nodes running multiple replicas.
- Active replica IP shown in the overview table — the dashboard now resolves which replica is active and displays the correct Mesh IP.
To manually promote a passive replica:
- In the Cloudflare dashboard ↗, go to Networking > Mesh.
- Select an HA-enabled node.
- Select the passive replica tab.
- Select Promote to active and confirm.
Traffic reroutes to the promoted replica immediately. Refer to High availability for details on failover behavior.
Wrangler supports using
wrangler containers sshas an OpenSSHProxyCommandfor Containers. This lets your local SSH client connect to a running Container through Wrangler.Terminal window ssh -o ProxyCommand="wrangler containers ssh %h" cloudchamber@<INSTANCE_ID>When standard input and output are piped, Wrangler forwards data to the SSH server in the Container. You can also pass
--stdioto force this mode.For more information, refer to the SSH documentation.
You can now send emails with display names on recipient addresses in addition to the existing
fromsupport. Pass an object withemailand an optionalnamefield forto,cc,bcc,replyTo, orfrom:src/index.js export default {async fetch(request, env) {const response = await env.EMAIL.send({from: { email: "support@example.com", name: "Support Team" },to: { email: "jane@example.com", name: "Jane Doe" },cc: ["manager@company.com",{ email: "team@company.com", name: "Engineering Team" },],subject: "Welcome!",html: "<h1>Thanks for joining!</h1>",text: "Thanks for joining!",});return Response.json({ messageId: response.messageId });},};src/index.ts export default {async fetch(request, env): Promise<Response> {const response = await env.EMAIL.send({from: { email: "support@example.com", name: "Support Team" },to: { email: "jane@example.com", name: "Jane Doe" },cc: ["manager@company.com",{ email: "team@company.com", name: "Engineering Team" },],subject: "Welcome!",html: "<h1>Thanks for joining!</h1>",text: "Thanks for joining!",});return Response.json({ messageId: response.messageId });},} satisfies ExportedHandler<Env>;Plain strings remain fully supported for backward compatibility, and you can mix strings and named objects in the same array.
Refer to the Workers API and REST API documentation for full request examples.
Cloudflare Pipelines is a streaming data platform that ingests events, transforms them with SQL, and writes to R2 as JSON, Parquet, or Apache Iceberg ↗ tables. Pipelines now has published pricing based on two usage dimensions: the volume of data processed by SQL transforms and the volume of data delivered to sinks. Ingress into a Pipeline stream is free.
Billing is not yet enabled. We will provide at least 30 days notice before we start charging for Pipelines usage.
Pipelines pricing model is designed to charge per GB based on what you use:
- Streams (ingress): Free, regardless of volume.
- SQL transforms: $0.04 / GB for stateless transforms (filter, reshape, unnest, cast, compute).
- Sinks: $0.03 / GB for JSON, $0.06 / GB for Parquet or Iceberg output.
Workers Free plans include 1 GB / month for each dimension. Workers Paid plans include 50 GB / month.
For full pricing details and billing examples, refer to Pipelines pricing.
R2 SQL is a serverless, distributed query engine that runs SQL against Apache Iceberg ↗ tables stored in R2 Data Catalog. R2 SQL now has published pricing based on a single dimension: the volume of compressed data scanned to execute your queries. At $2.50 / TB ($0.0025 / GB), R2 SQL is priced at half the cost of AWS Athena and less than half of Google BigQuery on-demand.
Billing is not yet enabled. We will provide at least 30 days notice before we start charging for R2 SQL usage.
Data scanned is measured on compressed bytes read from R2 object storage. This matches what you see in your R2 bucket — if a Parquet file is 100 MB on disk, scanning that file bills for 100 MB. Each query has a minimum billing increment of 10 MB.
Free plans include 1 GB / month and Paid plans include 10 GB / month. Standard R2 storage and operations and R2 Data Catalog charges apply separately.
For full pricing details and billing examples, refer to R2 SQL pricing.
R2 Data Catalog is a managed Apache Iceberg ↗ data catalog built directly into R2 buckets, queryable by any Iceberg-compatible engine such as Spark, Snowflake, and DuckDB. R2 Data Catalog now has published pricing for catalog operations and table compaction, in addition to standard R2 storage and operations.
Billing is not yet enabled. We will provide at least 30 days notice before we start charging for R2 Data Catalog usage.
Pricing is based on two dimensions:
- Catalog operations: $9.00 / million operations for metadata requests such as creating tables, reading table metadata, and updating table properties.
- Compaction: $0.005 / GB processed and $2.00 / million objects processed. These charges only apply when automatic compaction is turned on for a table.
Both dimensions include a monthly free tier: 1 million catalog operations, 10 GB of compaction data processed, and 1 million compaction objects processed.
For full pricing details and billing examples, refer to R2 Data Catalog pricing.
R2 Data Catalog is a managed Apache Iceberg ↗ data catalog built directly into your R2 bucket. It exposes a standard Iceberg REST catalog interface so you can connect query engines like Spark, Snowflake, DuckDB, and R2 SQL to your data in R2.
R2 Data Catalog now has a dedicated section in the Cloudflare dashboard, replacing the previous settings panel embedded in R2 bucket configuration. The new experience includes:
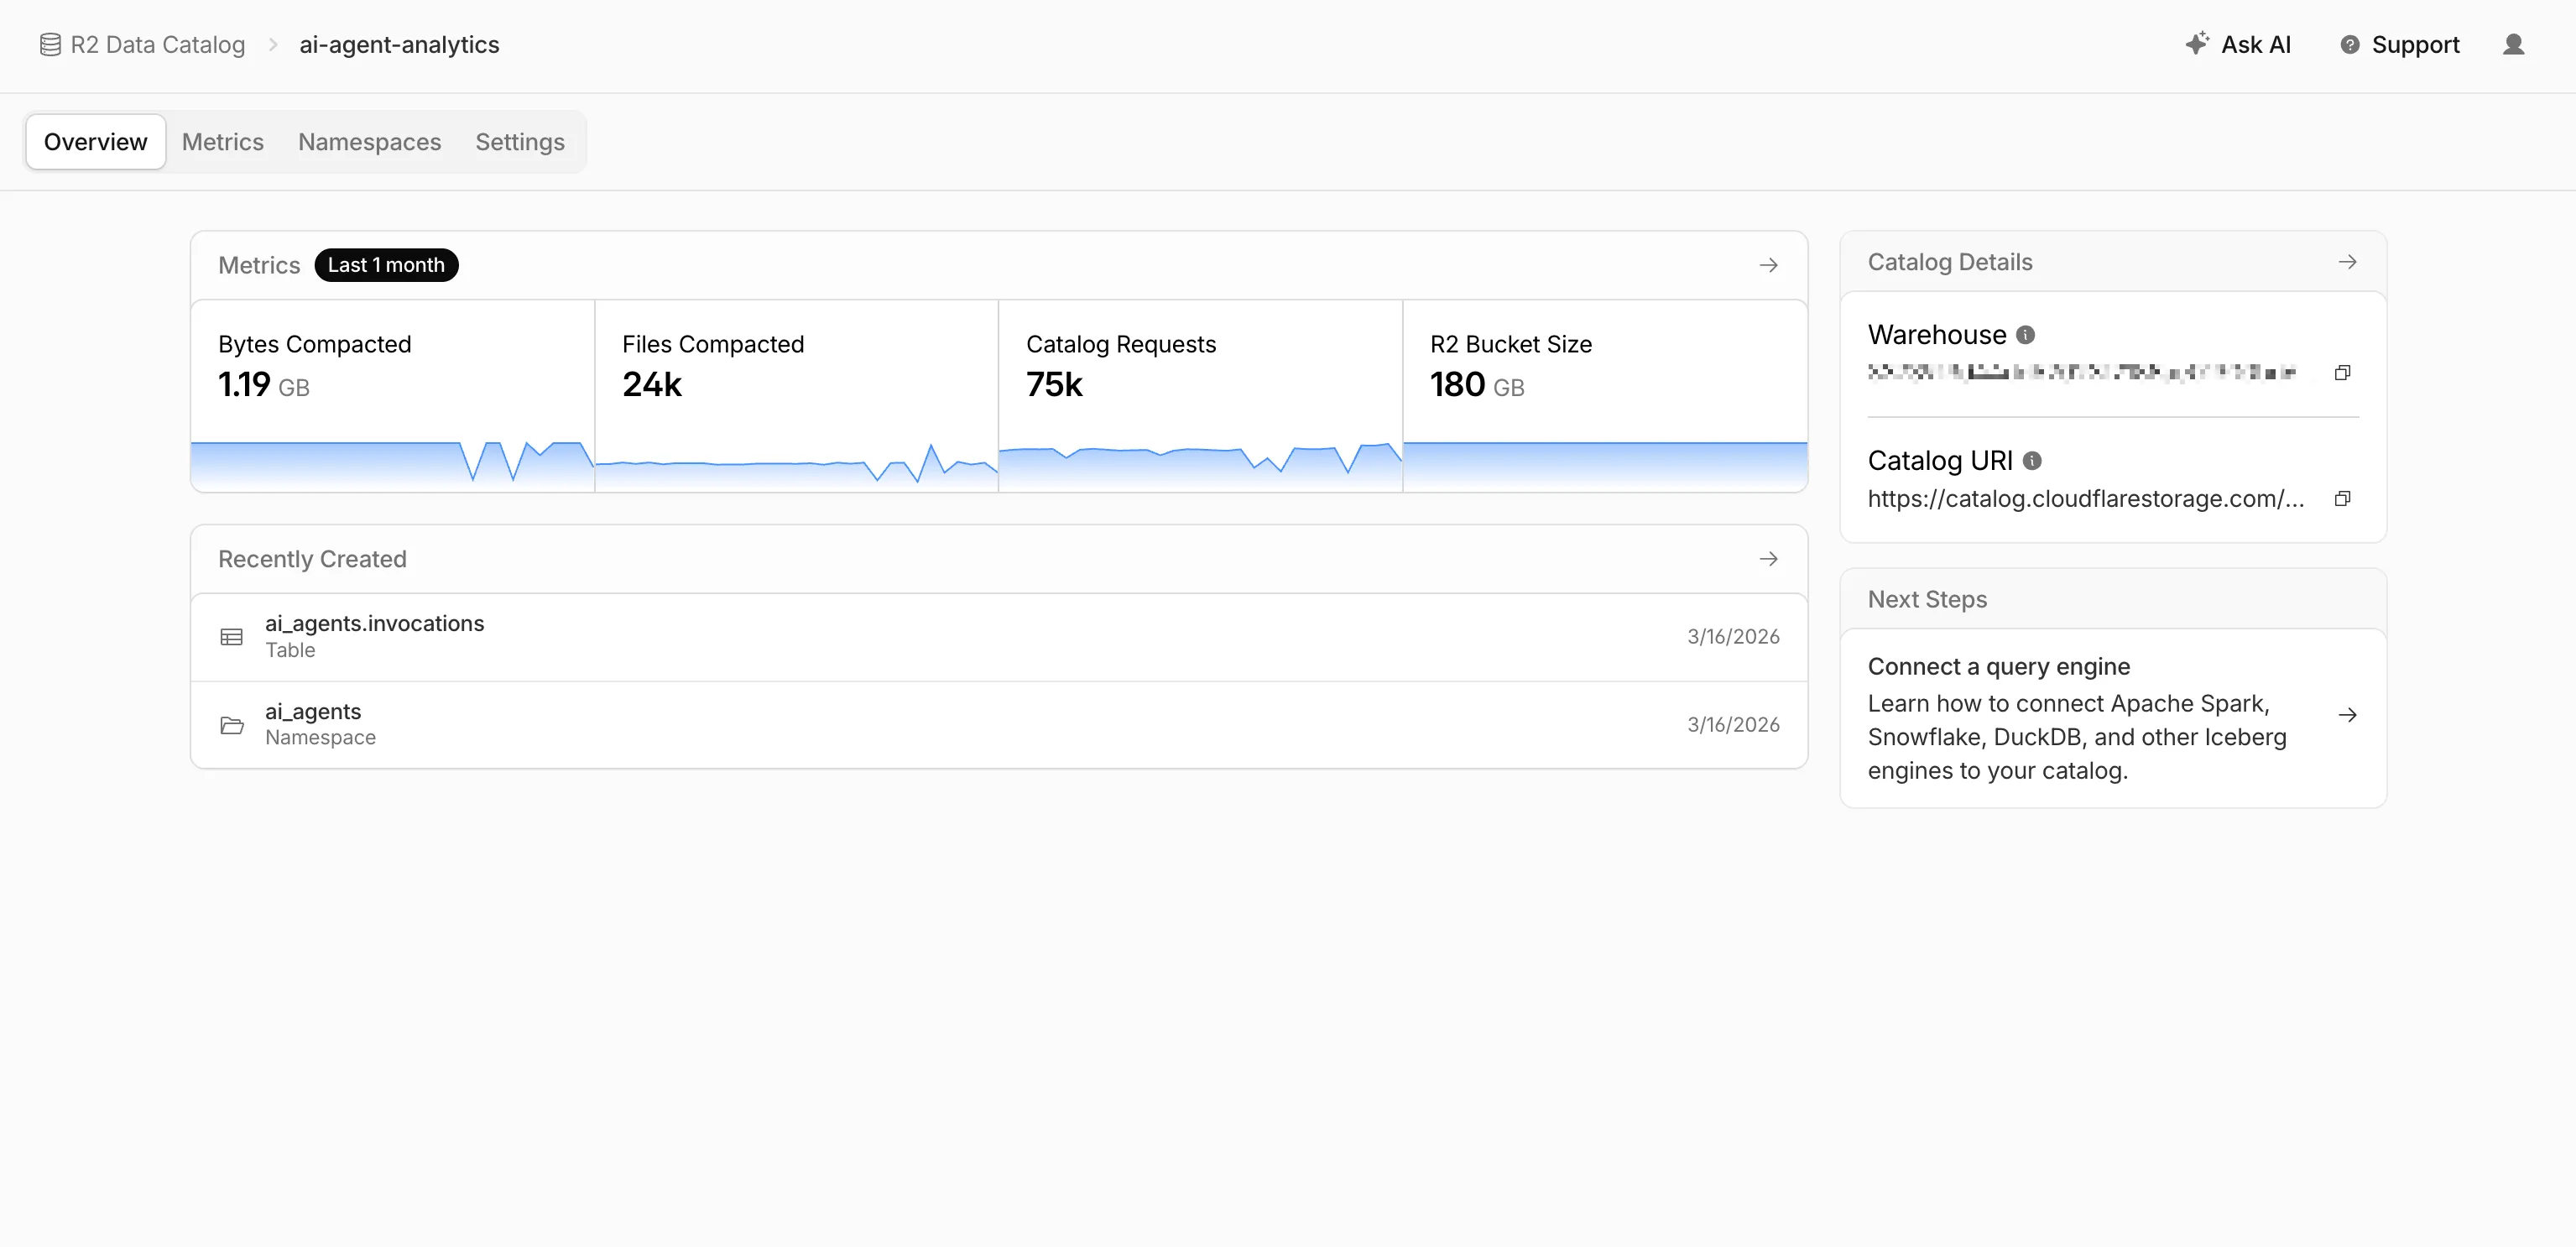
- Catalog overview — View all your catalogs in one place with catalog request counts, bucket sizes, and table maintenance status at a glance.
- Guided setup wizard — Create a catalog in three steps: choose or create an R2 bucket, configure table maintenance (compaction and snapshot expiration), and review. The wizard creates the bucket and generates a service credential automatically.
- Settings management — A dedicated settings page for each catalog with sections for general configuration, table maintenance, service credentials, and disabling the catalog. You can now enable and configure snapshot expiration directly from the dashboard.
- Built-in metrics — Five charts on each catalog's metrics tab: bytes compacted, files compacted, catalog requests, storage size, and snapshots expired.
To get started, go to R2 Data Catalog in the Cloudflare dashboard or refer to the getting started guide and manage catalogs documentation.
You can now record specific participant audio tracks in RealtimeKit with track recording. Track recording creates separate WebM files for each participant instead of a single composite recording, which is useful for post-processing, transcription, and regulated or content-sensitive workflows.
To record specific participants, pass
user_idswhen starting a track recording:Terminal window curl --request POST \--url https://api.cloudflare.com/client/v4/accounts/<account_id>/realtime/kit/<app_id>/recordings/track \--header 'Authorization: Bearer <api_token>' \--header 'Content-Type: application/json' \--data '{"meeting_id": "97440c6a-140b-40a9-9499-b23fd7a3868a","user_ids": ["user-123", "user-456"]}'To pass
user_idsfor selective track recording, use the following minimum SDK versions:- Web Core:
@cloudflare/realtimekitversion1.4.0or later - Web UI Kit:
@cloudflare/realtimekit-ui,@cloudflare/realtimekit-react-ui, or@cloudflare/realtimekit-angular-uiversion1.1.2or later - Android Core or iOS Core: version
2.0.0or later - Android UI Kit or iOS UI Kit: version
1.1.0or later
RealtimeKit provides SDKs and UI components so that you can build your own meeting experience on Cloudflare's global WebRTC infrastructure. Teams today build products ranging from telehealth to education on RealtimeKit for global audiences. You can get started today with our Quickstart or take a look at our Cloudflare Meet repo ↗ as a reference.
- Web Core:
Cloudflare Gateway policy selectors which support regular expressions can now be authored in the dashboard using natural language. When building a policy with a regex-based selector (like
matches regex), you can describe what you want to match in plain English and the Cloudflare Agent will generate and validate a corresponding regular expression.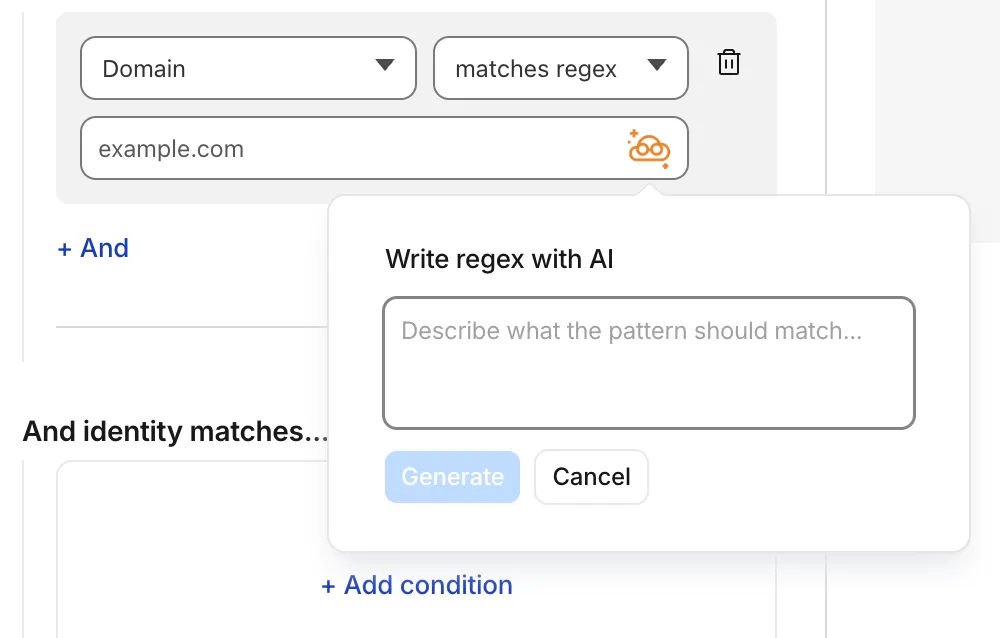
To get started, select a regex-compatible selector in the Gateway policy builder and select the icon. You'll see an input field for natural language, such as "any URL starting with /api/v1" or ".com, .net, and .app hosts which contain
goooglein the host."You can also use the tool to explain existing regular expressions. If a policy already contains a regex pattern, you can instantly generate a plain-language description.
A built-in feedback mechanism allows you to rate each interaction to help improve output quality over time.
For more information, refer to Cloudflare One firewall policies and expect to see the same functionality supported soon in Data loss prevention profiles.
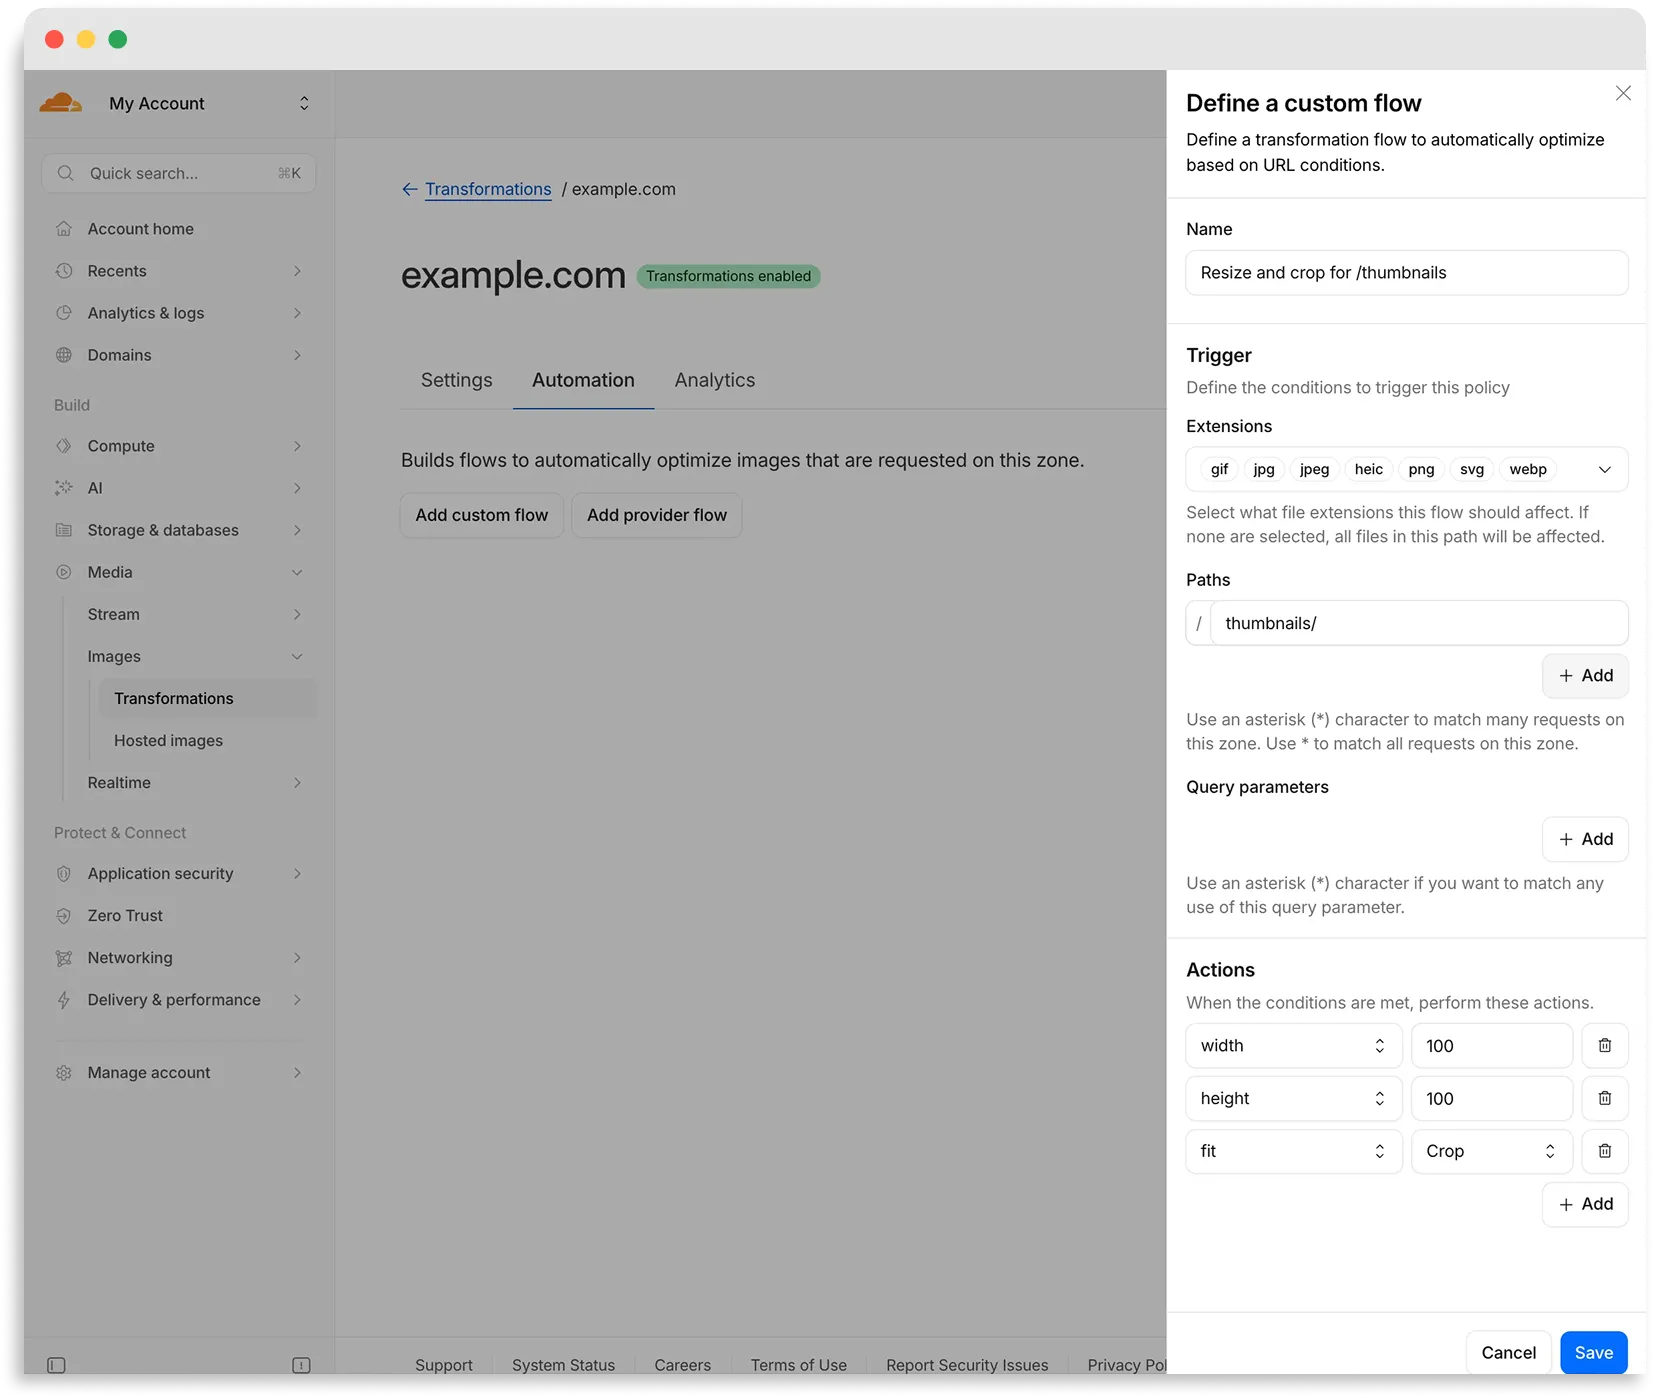
Flows are automated rules that pair conditions (such as file extension, URL path, or query parameter) with parameters. Set up a flow to automatically apply image optimization to matching requests on your zone without writing code or changing URLs.
There are two modes for transformation flows:
- Provider flows — Migrate from another image optimization service. Your existing URLs continue to work while Cloudflare rewrites provider-specific parameters to their Cloudflare equivalents. Currently, Cloudflare supports provider flows for Fastly Image Optimizer.
- Custom flows — Define your own conditions and actions for use cases like automatic format conversion, responsive sizing with
width=auto, or directory-based optimization.
To get started, go to Images > Transformations > Automation in the Cloudflare dashboard ↗.
Learn more about transformation flows.
Starting with
cloudflaredversion 2026.5.2 ↗, Cloudflare Tunnel automates the entire connectivity pre-checks workflow directly inside the binary. Previously, customers had to installdigandnetcatand run those commands by hand to verify their environment. Nowcloudflareddoes it natively at startup — and surfaces actionable remediation when something is blocked.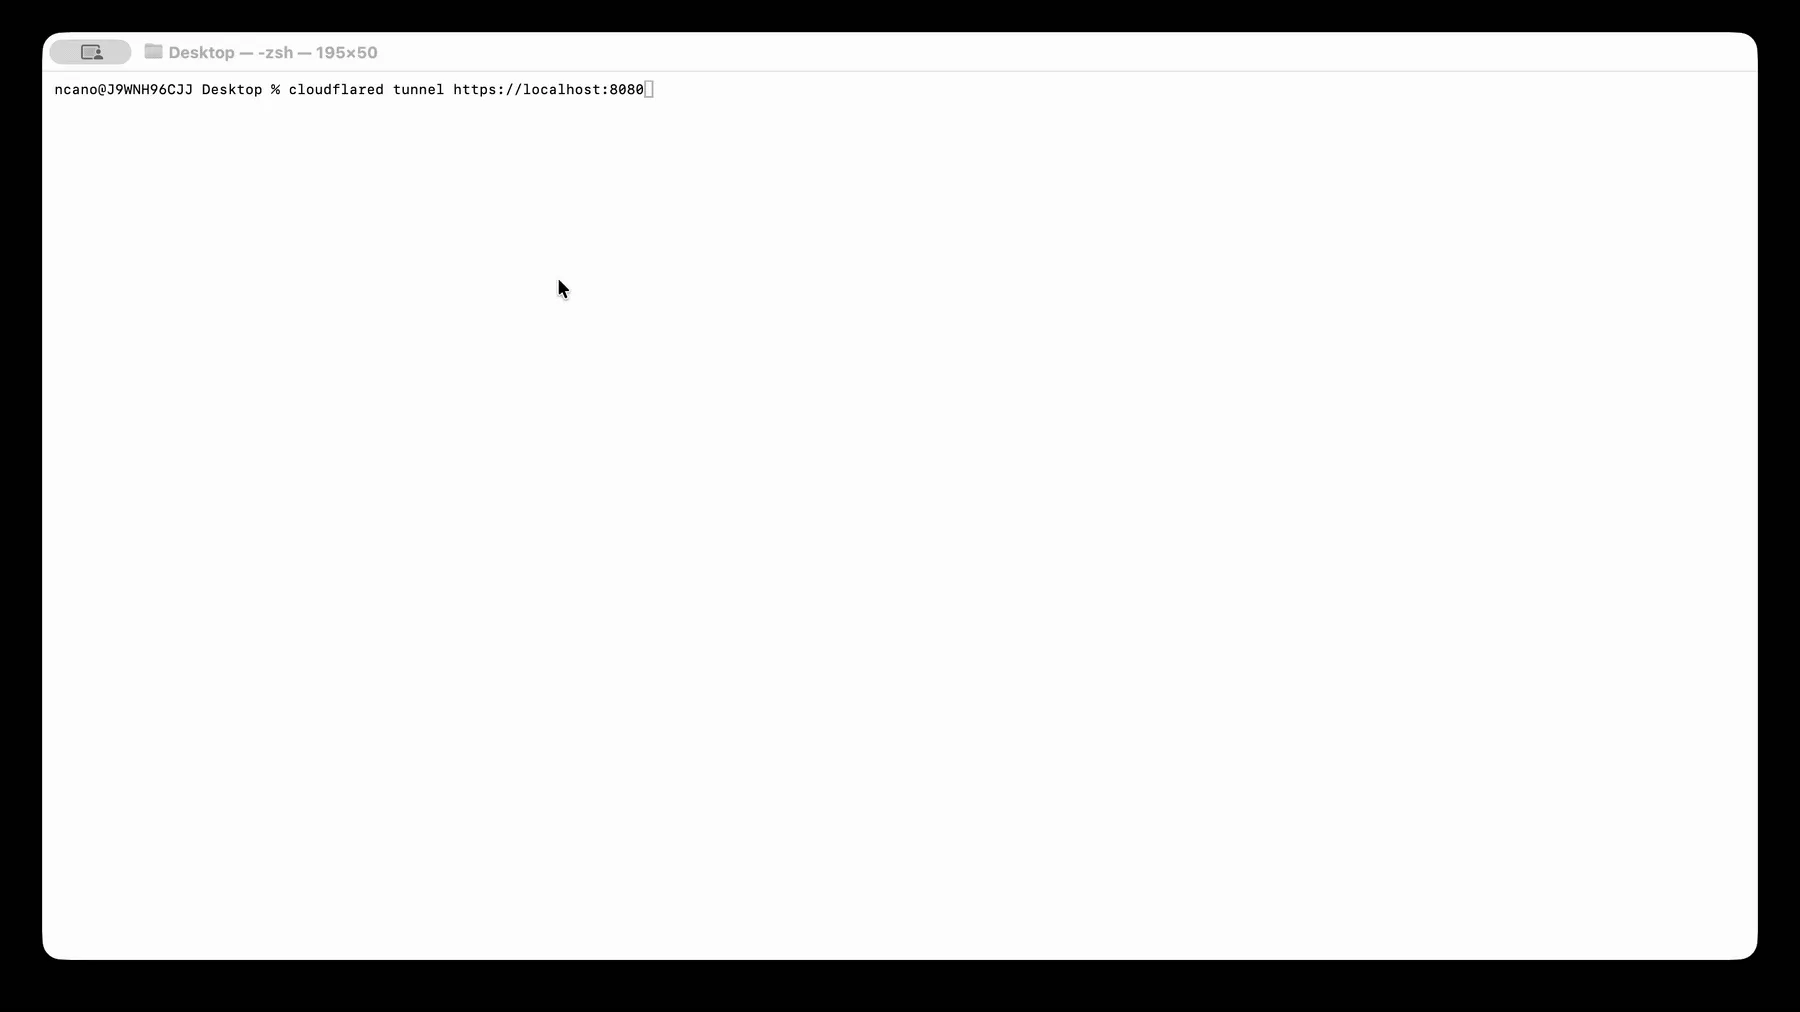
On every
cloudflared tunnel run(andcloudflared tunnel diag), the binary now natively checks:- DNS resolution —
region1.v2.argotunnel.comandregion2.v2.argotunnel.comresolve to valid Cloudflare IPs. - Transport connectivity — outbound
UDP (QUIC)andTCP (HTTP/2)on port7844. - Management API — outbound
TCP/443toapi.cloudflare.comfor software updates.
Results are printed in a scannable CLI table with three states:
- ✅ Pass — the check succeeded.
- ⚠️ Warn — a non-blocking issue, for example the Management API is unreachable so automatic updates will not work, but the tunnel will still come up.
- ❌ Fail — a blocking issue, with a specific remediation hint (for example,
Allow outbound UDP on port 7844).
If DNS is unresolvable, or both UDP and TCP fail on port 7844,
cloudflaredexits early with the failure rather than looping on opaquefailed to dialerrors.Pre-checks now run automatically on every start, which also catches regressions like overnight firewall policy changes — no need to remember to rerun the troubleshooting guide.
To get the new behavior, upgrade
cloudflaredto version2026.5.2or later. For more details, refer to the Connectivity pre-checks documentation.- DNS resolution —
A new GA release for the macOS Cloudflare One Client is now available on the stable releases downloads page.
This release introduces the new Cloudflare One Client UI for macOS! You can expect a cleaner and more intuitive design as well as easier access to common actions and information. Here are some of the many things we have found our users appreciate:
- Right click context menu to access the most common client actions quickly
- Built-in captive portal login experience
Additional Changes and improvements
- Added a new CLI command: warp-cli mdm refresh. This command executes an immediate refresh of the Mobile Device Management (MDM) configuration file.
- Fixed a proxy mode connection stall issue.
Known issues
- Registration may hang at "Checking your organization configuration" due to IPC errors. A system reboot should resolve the error, allowing registration to proceed.
- Split tunnel list configuration is not available in the new UI. Management of split tunnel entries is currently only possible via
warp-cli tunnel ipandwarp-cli tunnel host. UI support will be added in a future release.
A new GA release for the Windows Cloudflare One Client is now available on the stable releases downloads page.
This release introduces the new Cloudflare One Client UI for Windows! You can expect a cleaner and more intuitive design as well as easier access to common actions and information. Here are some of the many things we have found our users appreciate:
- Right click context menu to access the most common client actions quickly
- Built-in captive portal login experience
Additional Changes and improvements
- Added a new CLI command: warp-cli mdm refresh. This command executes an immediate refresh of the Mobile Device Management (MDM) configuration file.
- Fixed a proxy mode connection stall issue.
Known issues
- Registration authentication for devices via the integrated WebView2 browser is unavailable in this version as a temporary measure. As a result, the client will utilize the default browser on the device to complete the authentication process.
- An error indicating that Microsoft Edge can't read and write to its data directory may be displayed during captive portal login; this error is benign and can be dismissed.
- Registration may hang at "Checking your organization configuration" due to IPC errors. A system reboot should resolve the error, allowing registration to proceed.
- Split tunnel list configuration is not available in the new UI. Management of Split Tunnel entries is currently only possible via
warp-cli tunnel ipandwarp-cli tunnel host. UI support will be added in a future release. - Windows ARM may prompt the user to close running applications while trying to install this version. Simply click “Ok” with the default highlighted option.
- DNS resolution may be broken when the following conditions are all true:
- The client is in Secure Web Gateway without DNS filtering (tunnel-only) mode.
- A custom DNS server address is configured on the primary network adapter.
- The custom DNS server address on the primary network adapter is changed while the client is connected.
To work around this issue, please reconnect the client by selecting "disconnect" and then "connect" in the client user interface.
A new GA release for the Linux Cloudflare One Client is now available on the stable releases downloads page.
This release introduces the new Cloudflare One Client UI for Linux! You can expect a cleaner and more intuitive design as well as easier access to common actions and information. Here are some of the many things we have found our users appreciate:
- Right click context menu to access the most common client actions quickly
- Built-in captive portal login experience
Changes and improvements
- Added a new CLI command: warp-cli mdm refresh. This command executes an immediate refresh of the Mobile Device Management (MDM) configuration file.
- Official support for RHEL 9 has been added for Cloudflare Mesh nodes. To install the RHEL 9 package, the Extra Packages for Enterprise Linux (EPEL) repository must be active, as it contains dependencies required for the tray icon and captive portal webview.
- Fixed a proxy mode connection stall issue.
Known issues
- Registration may hang at "Checking your organization configuration" due to IPC errors. A system reboot should resolve the error, allowing registration to proceed.
- Split tunnel list configuration is not available in the new UI. Management of split tunnel entries is currently only possible via
warp-cli tunnel ipandwarp-cli tunnel host. UI support will be added in a future release.
Cloudflare now returns a
BYPASScache status whenever a response is not cacheable, instead of the previous mix ofBYPASSandMISSthat depended on why Cloudflare chose not to cache the response.There are multiple reasons Cloudflare may refuse to cache a response — for example, the response exceeds the maximum cacheable file size for your plan, the origin sends
Cache-Control: no-cache,private, ormax-age=0, the response includes aSet-Cookieheader, or the request includes anAuthorizationheader.Previously, only some of these conditions returned
BYPASS. Others — such as responses exceeding the maximum cacheable file size — returnedMISSon every request, regardless of whether Origin Cache Control was on or off. Because the response could never be cached, every subsequent request also returnedMISS, which looked indistinguishable from a broken cache and made it hard to tell whether Cloudflare was trying and failing to cache the asset or had deliberately chosen not to cache it.BYPASSnow consistently signals that Cloudflare refused to cache the response, regardless of the reason.MISSis reserved for cacheable responses that simply were not in the local cache at request time.After this change rolls out, you should see:
- MISS rate decreases: Uncacheable responses no longer count as cache misses.
- BYPASS rate increases: These same responses are now reported as bypasses.
- Cache hit ratio increases: Hit ratio calculations no longer include uncacheable traffic that could never have been cached, giving you a more accurate view of cache effectiveness.
Your total request volume and origin traffic are unchanged — only the cache status label is different.
The cache status label is the only thing changing — browser cache TTL handling for any given response is identical to what it was before:
- Responses that historically returned
MISSbecause Cloudflare refused to cache them (for example, responses over the maximum cacheable file size) now returnBYPASS, but continue to have browser cache TTL applied — exactly as they did when they were labeledMISS. - Responses that historically returned
BYPASSand skipped browser cache TTL continue to skip browser cache TTL.
In both cases, the decision to apply browser cache TTL depends on the underlying reason Cloudflare did not cache the response, not on the new
BYPASSlabel.
Flagship is now in public beta. Evaluate feature flags directly from Cloudflare Workers with no outbound HTTP calls, using globally distributed flag configuration backed by Workers KV and Durable Objects. Flagship supports typed flag values, targeting rules, percentage rollouts, audit history, and OpenFeature-compatible SDKs.
Evaluate a flag from a Worker in a few lines of code:
src/index.js export default {async fetch(request, env) {const showNewCheckout = await env.FLAGS.getBooleanValue("new-checkout",false,);return new Response(showNewCheckout ? "New checkout" : "Standard checkout");},};src/index.ts export default {async fetch(request: Request, env: Env): Promise<Response> {const showNewCheckout = await env.FLAGS.getBooleanValue("new-checkout", false);return new Response(showNewCheckout ? "New checkout" : "Standard checkout",);},} satisfies ExportedHandler<Env>;Start creating flags from the Cloudflare dashboard today. Refer to the Flagship documentation to get started.
AI Gateway now uses the AI REST API on
api.cloudflare.com. You can call any model — whether from OpenAI, Anthropic, Google, or hosted on Workers AI — through one unified API, using the same endpoints and authentication regardless of provider. Four endpoints are available:POST /ai/run— universal endpoint for all models and modalitiesPOST /ai/v1/chat/completions— OpenAI SDK compatiblePOST /ai/v1/responses— OpenAI Responses API compatiblePOST /ai/v1/messages— Anthropic SDK compatible
Terminal window curl -X POST "https://api.cloudflare.com/client/v4/accounts/$CLOUDFLARE_ACCOUNT_ID/ai/v1/chat/completions" \--header "Authorization: Bearer $CLOUDFLARE_API_TOKEN" \--header "Content-Type: application/json" \--data '{"model": "openai/gpt-5.5","messages": [{"role": "user", "content": "What is Cloudflare?"}]}'All AI Gateway features — logging, caching, rate limiting, and guardrails — are applied automatically. Third-party models are billed through Unified Billing, so you do not need to manage separate provider API keys.
Third-party model requests are routed through your account's default gateway, which is created automatically on first use. To route requests through a specific gateway, add the
cf-aig-gateway-idheader.If you are already calling Workers AI models through the existing REST API, that path (
/ai/run/@cf/{model}) continues to work. To call Workers AI models through AI Gateway, use the@cf/model prefix (for example,@cf/moonshotai/kimi-k2.6) and include thecf-aig-gateway-idheader to specify which gateway to route through.For more details and examples, refer to the REST API documentation.
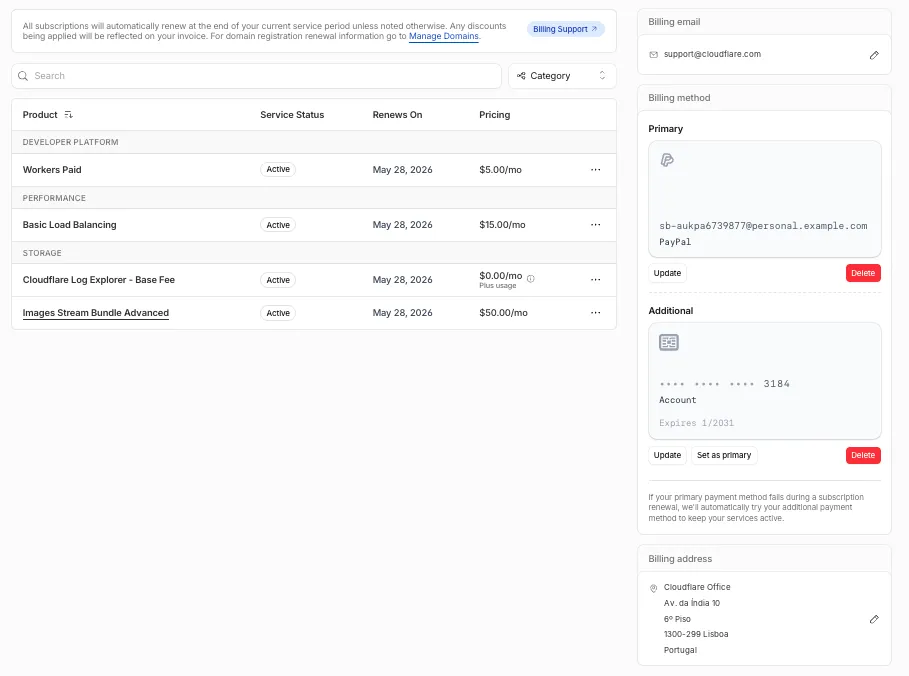
The Billing Profile now has a modern UI and a single space that unifies billing information, payment method management and an enhanced subscriptions view under a single Subscriptions tab.
The Subscriptions tab brings billing information, payment method management, and your subscriptions together in one place. The payment management and Pay overdue balances flows now use the latest checkout as product purchase flows, so you can pay with Apple Pay, Google Pay, Link, and Instant Bank Payments via Link alongside cards and PayPal.
New cards complete 3D Secure authentication when the issuer requires it — for example, the EU under PSD2 and India under RBI.
For details, refer to the Billing Home documentation.
You can now scope Cloudflare permissions to individual Cloudflare Tunnel instances and Cloudflare Mesh nodes. Administrators can delegate access to specific Tunnels or Mesh nodes without granting account-wide control over private networking.
When you add a member or create a permission policy, the resource picker now lists Cloudflare Tunnel instances and Cloudflare Mesh nodes as scopable resource types. You can:
- Grant a read-only role on a single Cloudflare Tunnel instance to a support operator for log streaming and diagnostics — without exposing other Tunnels or destructive actions.
- Grant a write role on a specific Cloudflare Mesh node to an application team — without giving them access to the rest of your private network.
- Scope a single policy to one or many Tunnels and Mesh nodes at once.
Granular permissions are a parallel layer to existing account-level roles — they do not replace them.
- Existing account-level roles continue to work. A member with
Cloudflare AccessorCloudflare Zero Trustretains write access to every Tunnel and Mesh node in the account. This ensures backward compatibility for existing automation and tokens. - Granular permissions are additive. For any API request on a specific Tunnel or Mesh node, access is granted if the principal has either the account-level role or a granular permission for that resource.
- Resource enumeration is authorization-aware. Listing endpoints (
GET /accounts/{id}/cfd_tunnel,GET /accounts/{id}/warp_connector) return only the resources the principal has at least read access to.
- Configure granular permissions for Cloudflare Tunnel.
- Configure granular permissions for Cloudflare Tunnel and Cloudflare Mesh in Cloudflare One.
- Review the resource-scoped roles on the Cloudflare role reference.
You can now use VPC Network bindings with
network_id: "cf1:network"to reach your full private network from Workers, including:- Cloudflare Mesh nodes and client devices
- Subnet routes and hostname routes announced through Cloudflare Tunnel or Cloudflare Mesh
- Destinations connected through Cloudflare WAN on-ramps — GRE, IPsec, and CNI
This means a single VPC Network binding can route Worker requests to private services regardless of how those services are connected to Cloudflare: through a Cloudflare Tunnel from a cloud VPC, a Mesh node on a private subnet, or a Cloudflare WAN on-ramp from your data center or branch site.
JSONC {"vpc_networks": [{"binding": "PRIVATE_NETWORK","network_id": "cf1:network","remote": true,},],}TOML [[vpc_networks]]binding = "PRIVATE_NETWORK"network_id = "cf1:network"remote = trueAt runtime, the URL you pass to
fetch()determines the destination:JavaScript // Reach a service behind a Cloudflare WAN IPsec on-rampconst response = await env.PRIVATE_NETWORK.fetch("http://10.50.0.100:8080/api");For configuration options, refer to VPC Networks.
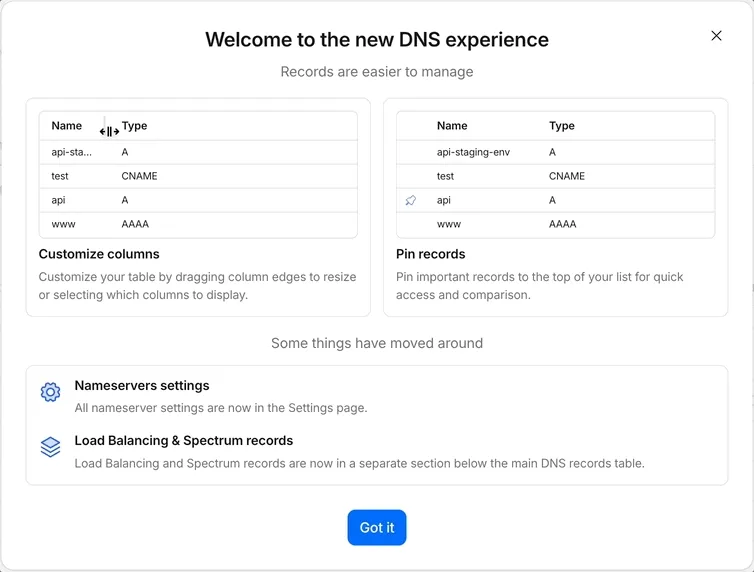
Starting today, everyone can opt in to a refreshed DNS records page in the Cloudflare dashboard. Over the coming weeks, the new experience will become the default for Free plan users first, followed by paid plans.
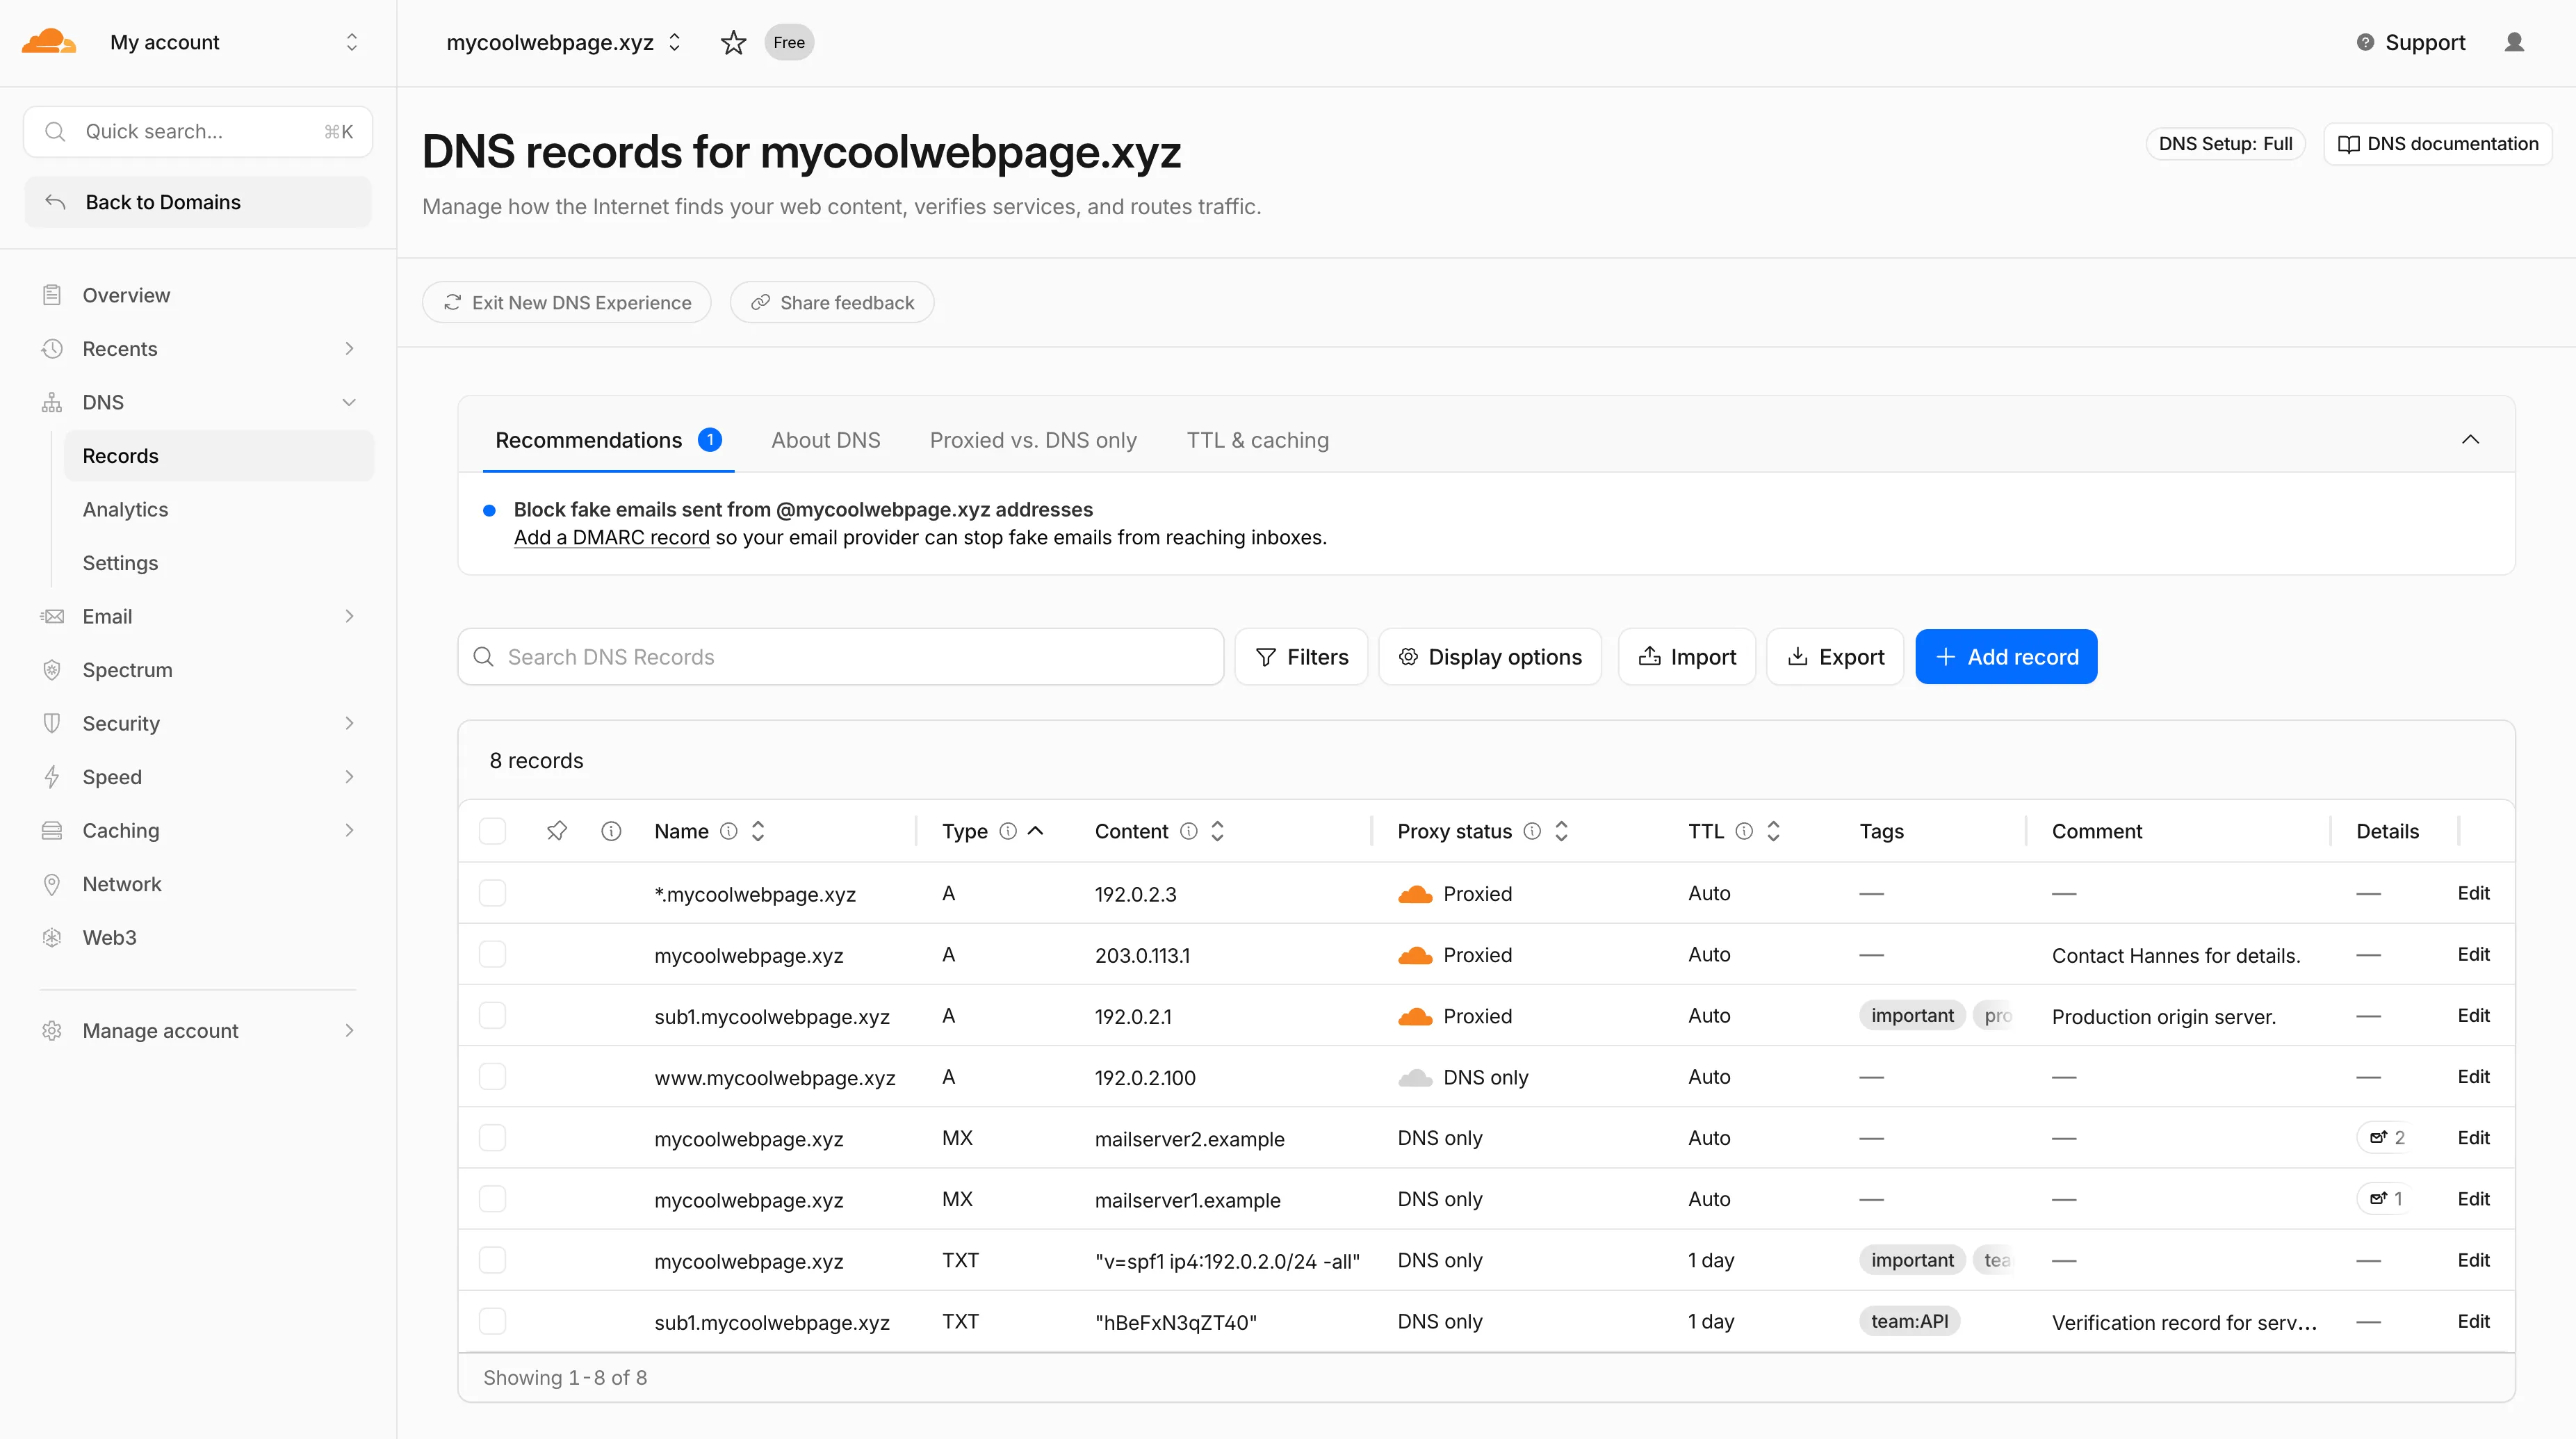
- Better table experience: resizable and hideable columns, row pinning, advanced filters with logical operators (AND/OR), configurable pagination, and expanded input fields so long values are no longer cut off.
- First-class mobile experience: responsive layout with a touch-friendly, card-based UI and compact controls for small screens.
- DNS quick reference: bite-sized explainers for DNS, proxy status, and TTL, available directly in the product to help users configure records without leaving the page.
- Modern frontend: a refactor onto Cloudflare's new UI framework that improves performance and lays the foundation for future improvements.
Dates are subject to change based on feedback received during the rollout.
- 20 May - 05 June: ramped rollout to Free, then Pro and Business plans.
- 08 June - 03 July: ramped rollout to Enterprise plans.
Once the new experience is turned on for your account, look for the feedback link at the top of the DNS records page in the Cloudflare dashboard and let us know what you think. Your input helps us prioritize the next round of improvements.
Radar now includes two new charts on the traffic page ↗ that provide deeper insights into the composition of HTTP traffic: a content type distribution chart and an API traffic share chart.
The new Content type ↗ chart displays the distribution of HTTP response content types, grouped into high-level categories. A traffic type selector allows filtering by human, bot, or all traffic. The existing Bot vs. Human ↗ chart also gained a content type category filter, allowing users to see the bot/human split for specific content categories.
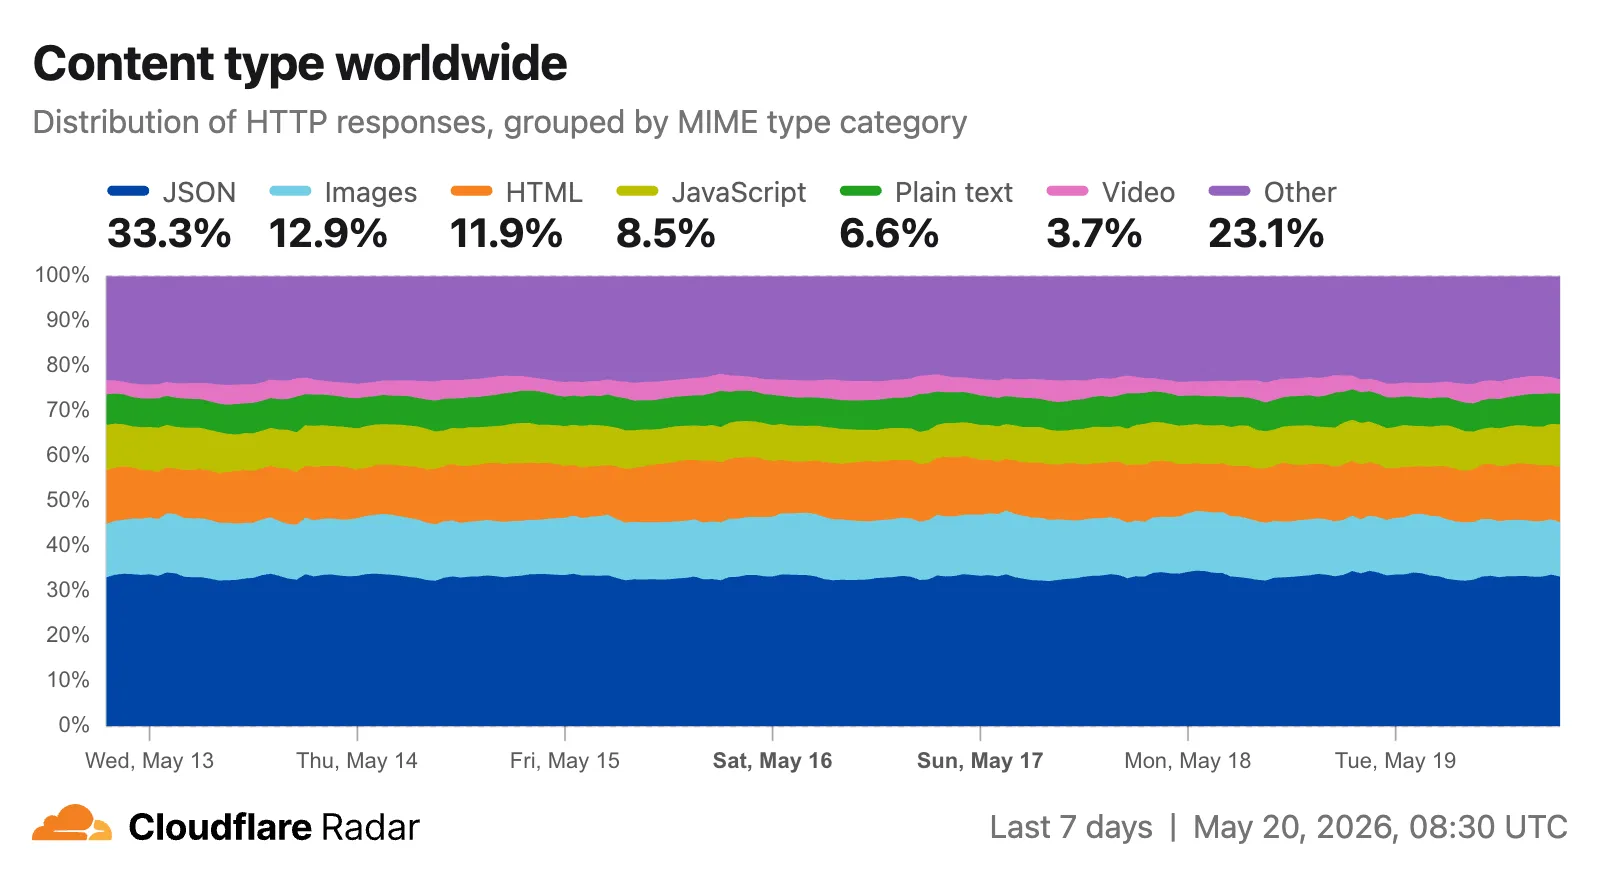
Content type categories:
- HTML — Web pages (
text/html) - Images — All image formats (
image/*) - JSON — JSON data and API responses (
application/json,*+json) - JavaScript — Scripts (
application/javascript,text/javascript) - CSS — Stylesheets (
text/css) - Plain Text — Unformatted text (
text/plain) - Fonts — Web fonts (
font/*,application/font-*) - XML — XML documents and feeds (
text/xml,application/xml,application/rss+xml,application/atom+xml) - YAML — Configuration files (
text/yaml,application/yaml) - Video — Video content and streaming (
video/*,application/ogg,*mpegurl) - Audio — Audio content (
audio/*) - Markdown — Markdown documents (
text/markdown) - Documents — PDFs, Office documents, ePub, CSV (
application/pdf,application/msword,text/csv) - Binary — Executables, archives, WebAssembly (
application/octet-stream,application/zip,application/wasm) - Serialization — Binary API formats (
application/protobuf,application/grpc,application/msgpack) - Other — All other content types
The
CONTENT_TYPEdimension andcontentTypefilter are available on the HTTP summary, timeseries groups, and timeseries endpoints.The new API traffic ↗ chart shows the percentage of dynamic (non-cacheable) HTTP request traffic that is API-related. API traffic is identified by JSON or XML response content types (
application/json,application/xml,text/xml) on HTTP requests that returned a 200 status code. A traffic type selector allows switching between human traffic, bot traffic, or all traffic.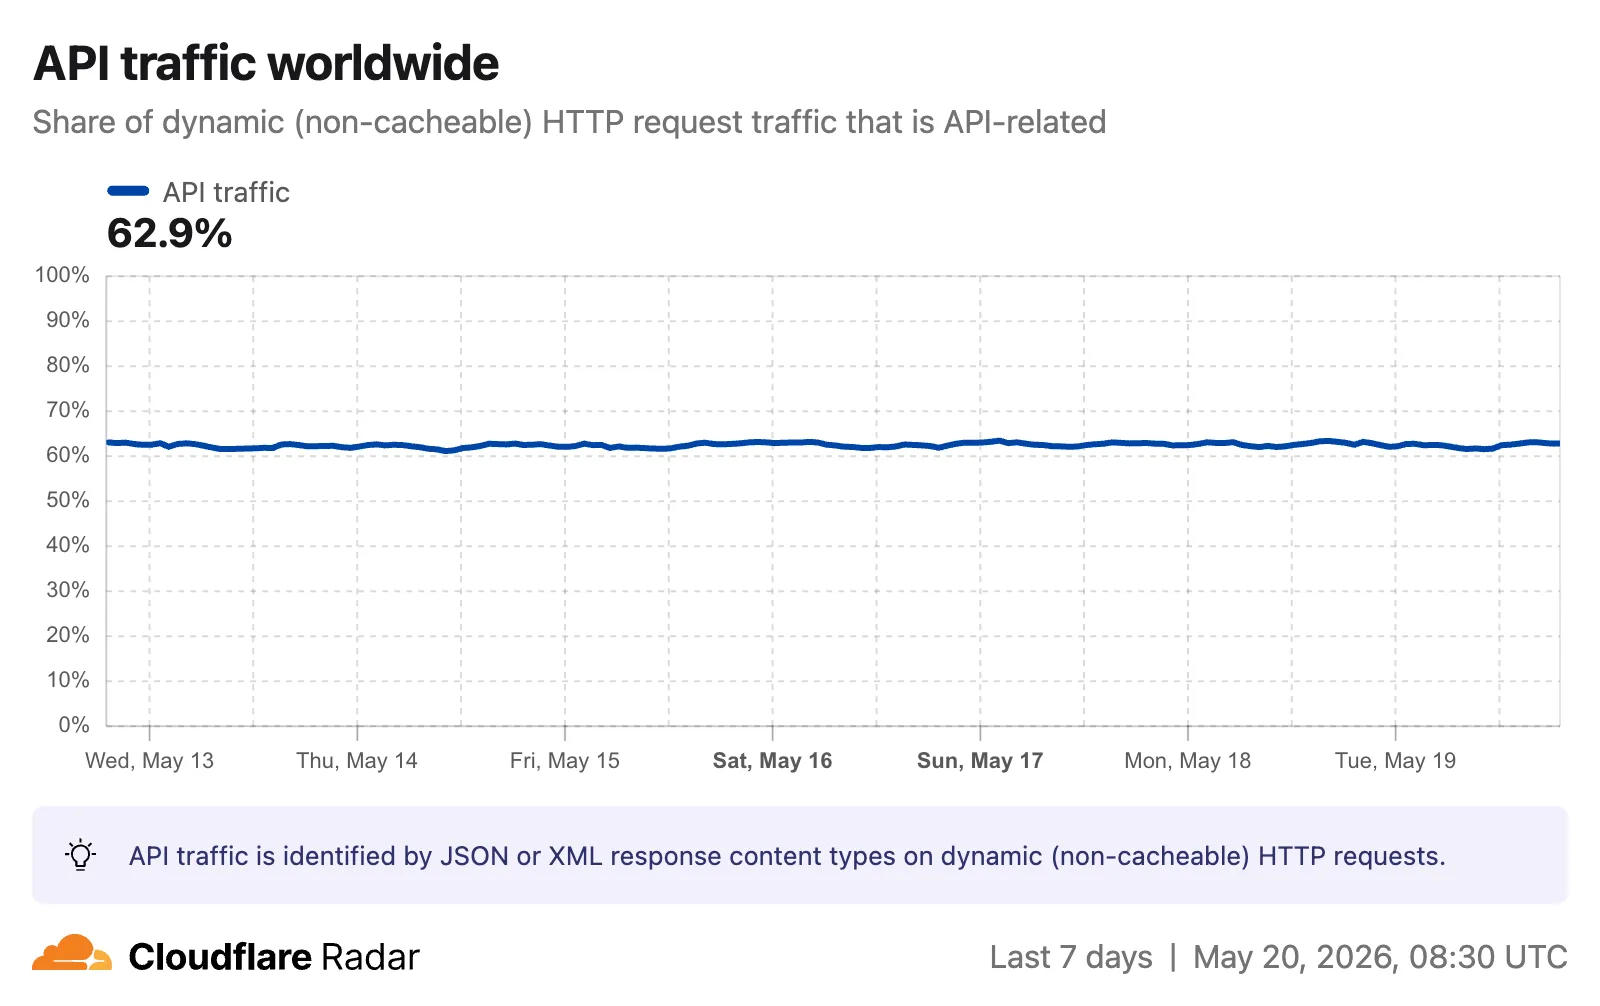
The
API_TRAFFICdimension is available on the existing HTTP summary and timeseries groups endpoints. AnapiTrafficfilter (APIorNON_API) can also be applied to HTTP timeseries requests to retrieve raw request counts for API-only or non-API traffic.Visit the Radar traffic page ↗ to explore these new charts.
- HTML — Web pages (